Version 1.0 — Effective date: June 2026 — Atem Nuevas Tecnologías SL
1. Parties and Acceptance
This Beta Program Participant Agreement (“Agreement”) is entered into between Atem Nuevas Tecnologías SL (“Company”, “we”, “us”), a company incorporated in Salamanca, Spain, operating the InVariants platform, and you, the individual or entity that submits a Beta access request (“Participant”, “you”). By checking the acceptance box and/or accessing the InVariants platform, you acknowledge that you have read, understood, and agree to be bound by this Agreement in its entirety.
If you are accepting on behalf of a company or other legal entity, you represent that you have the authority to bind that entity.
2. Beta Program Description
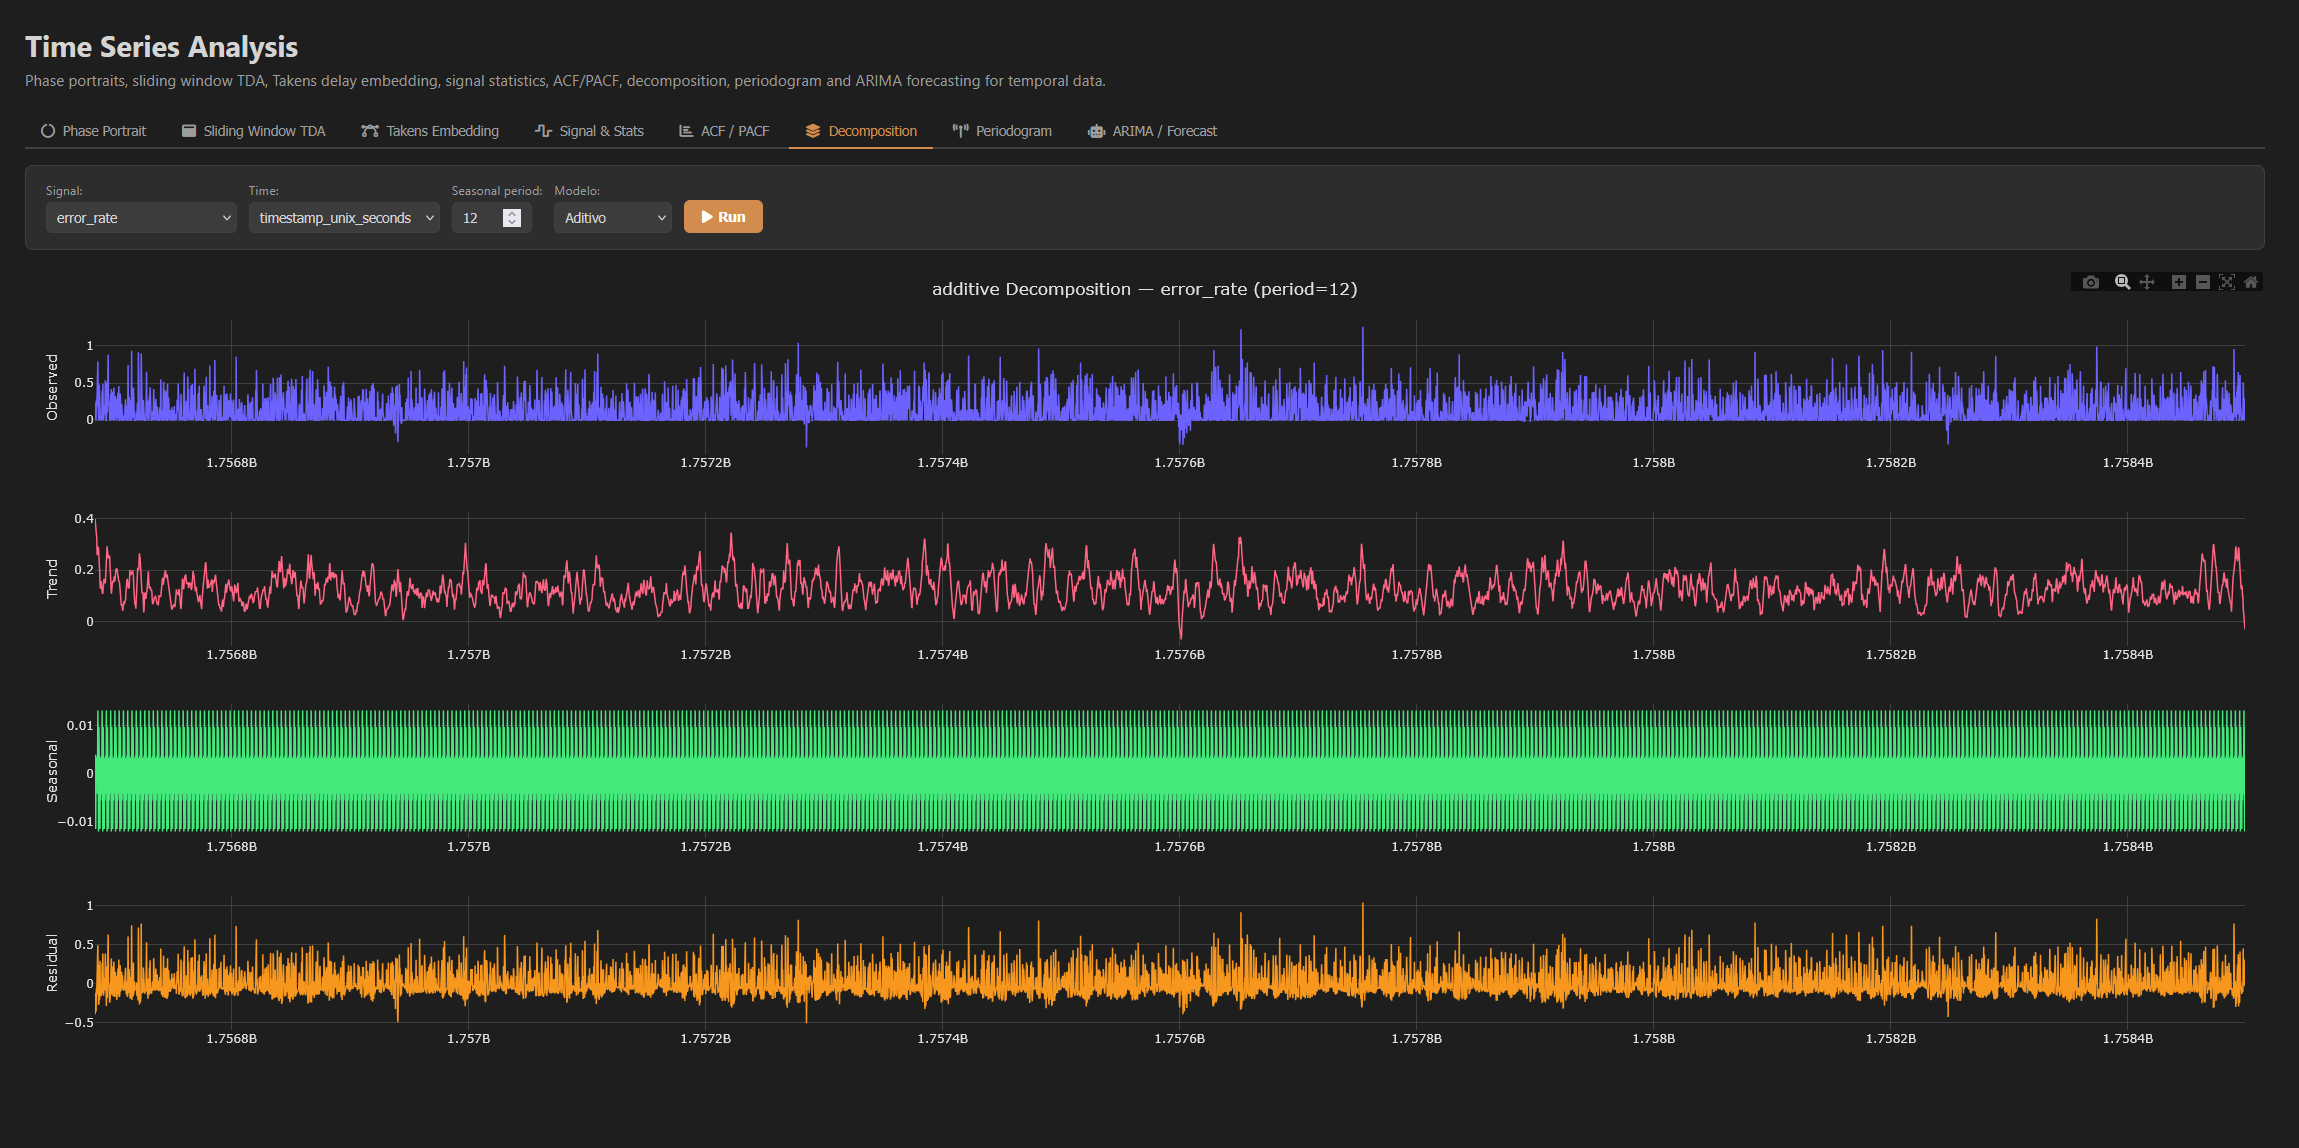
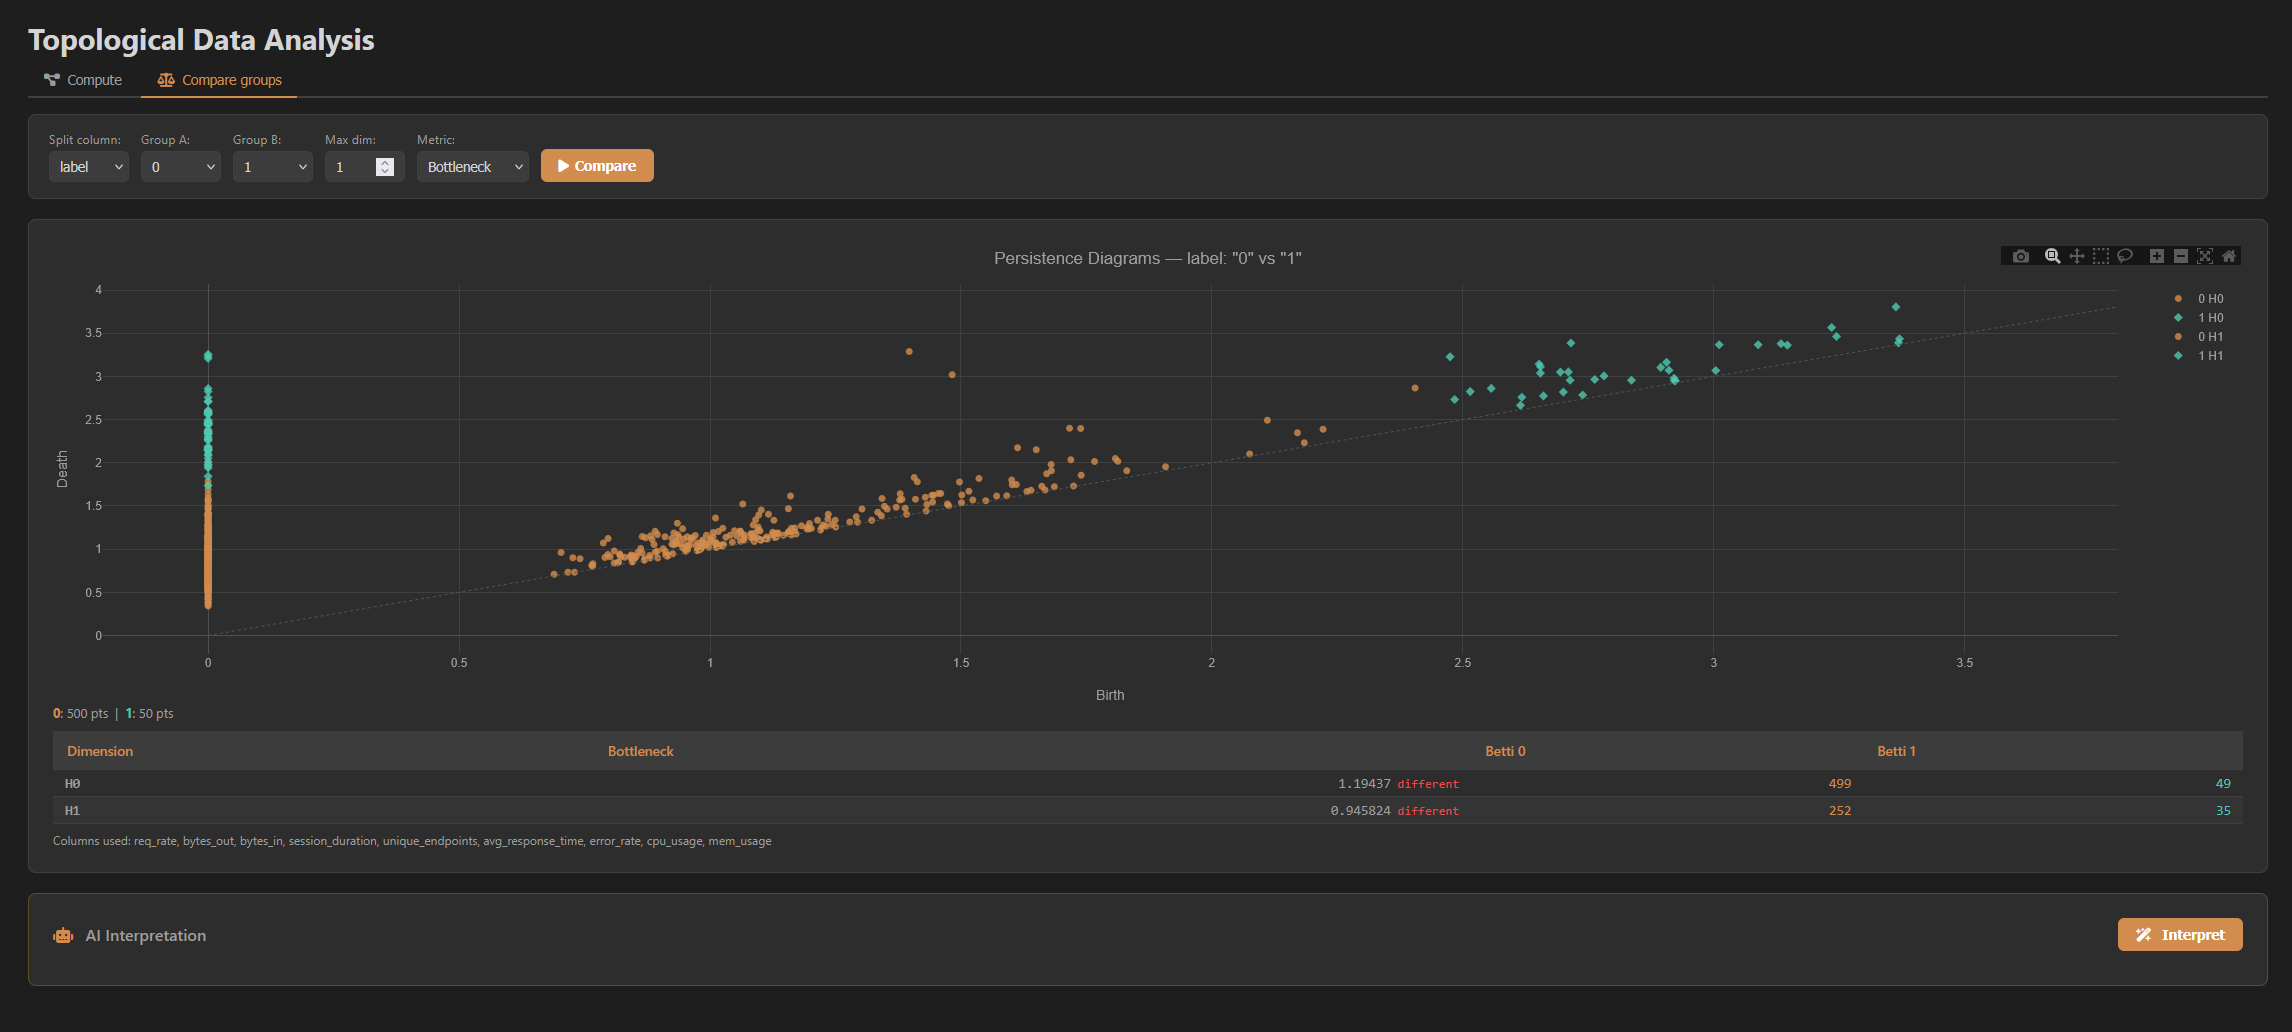
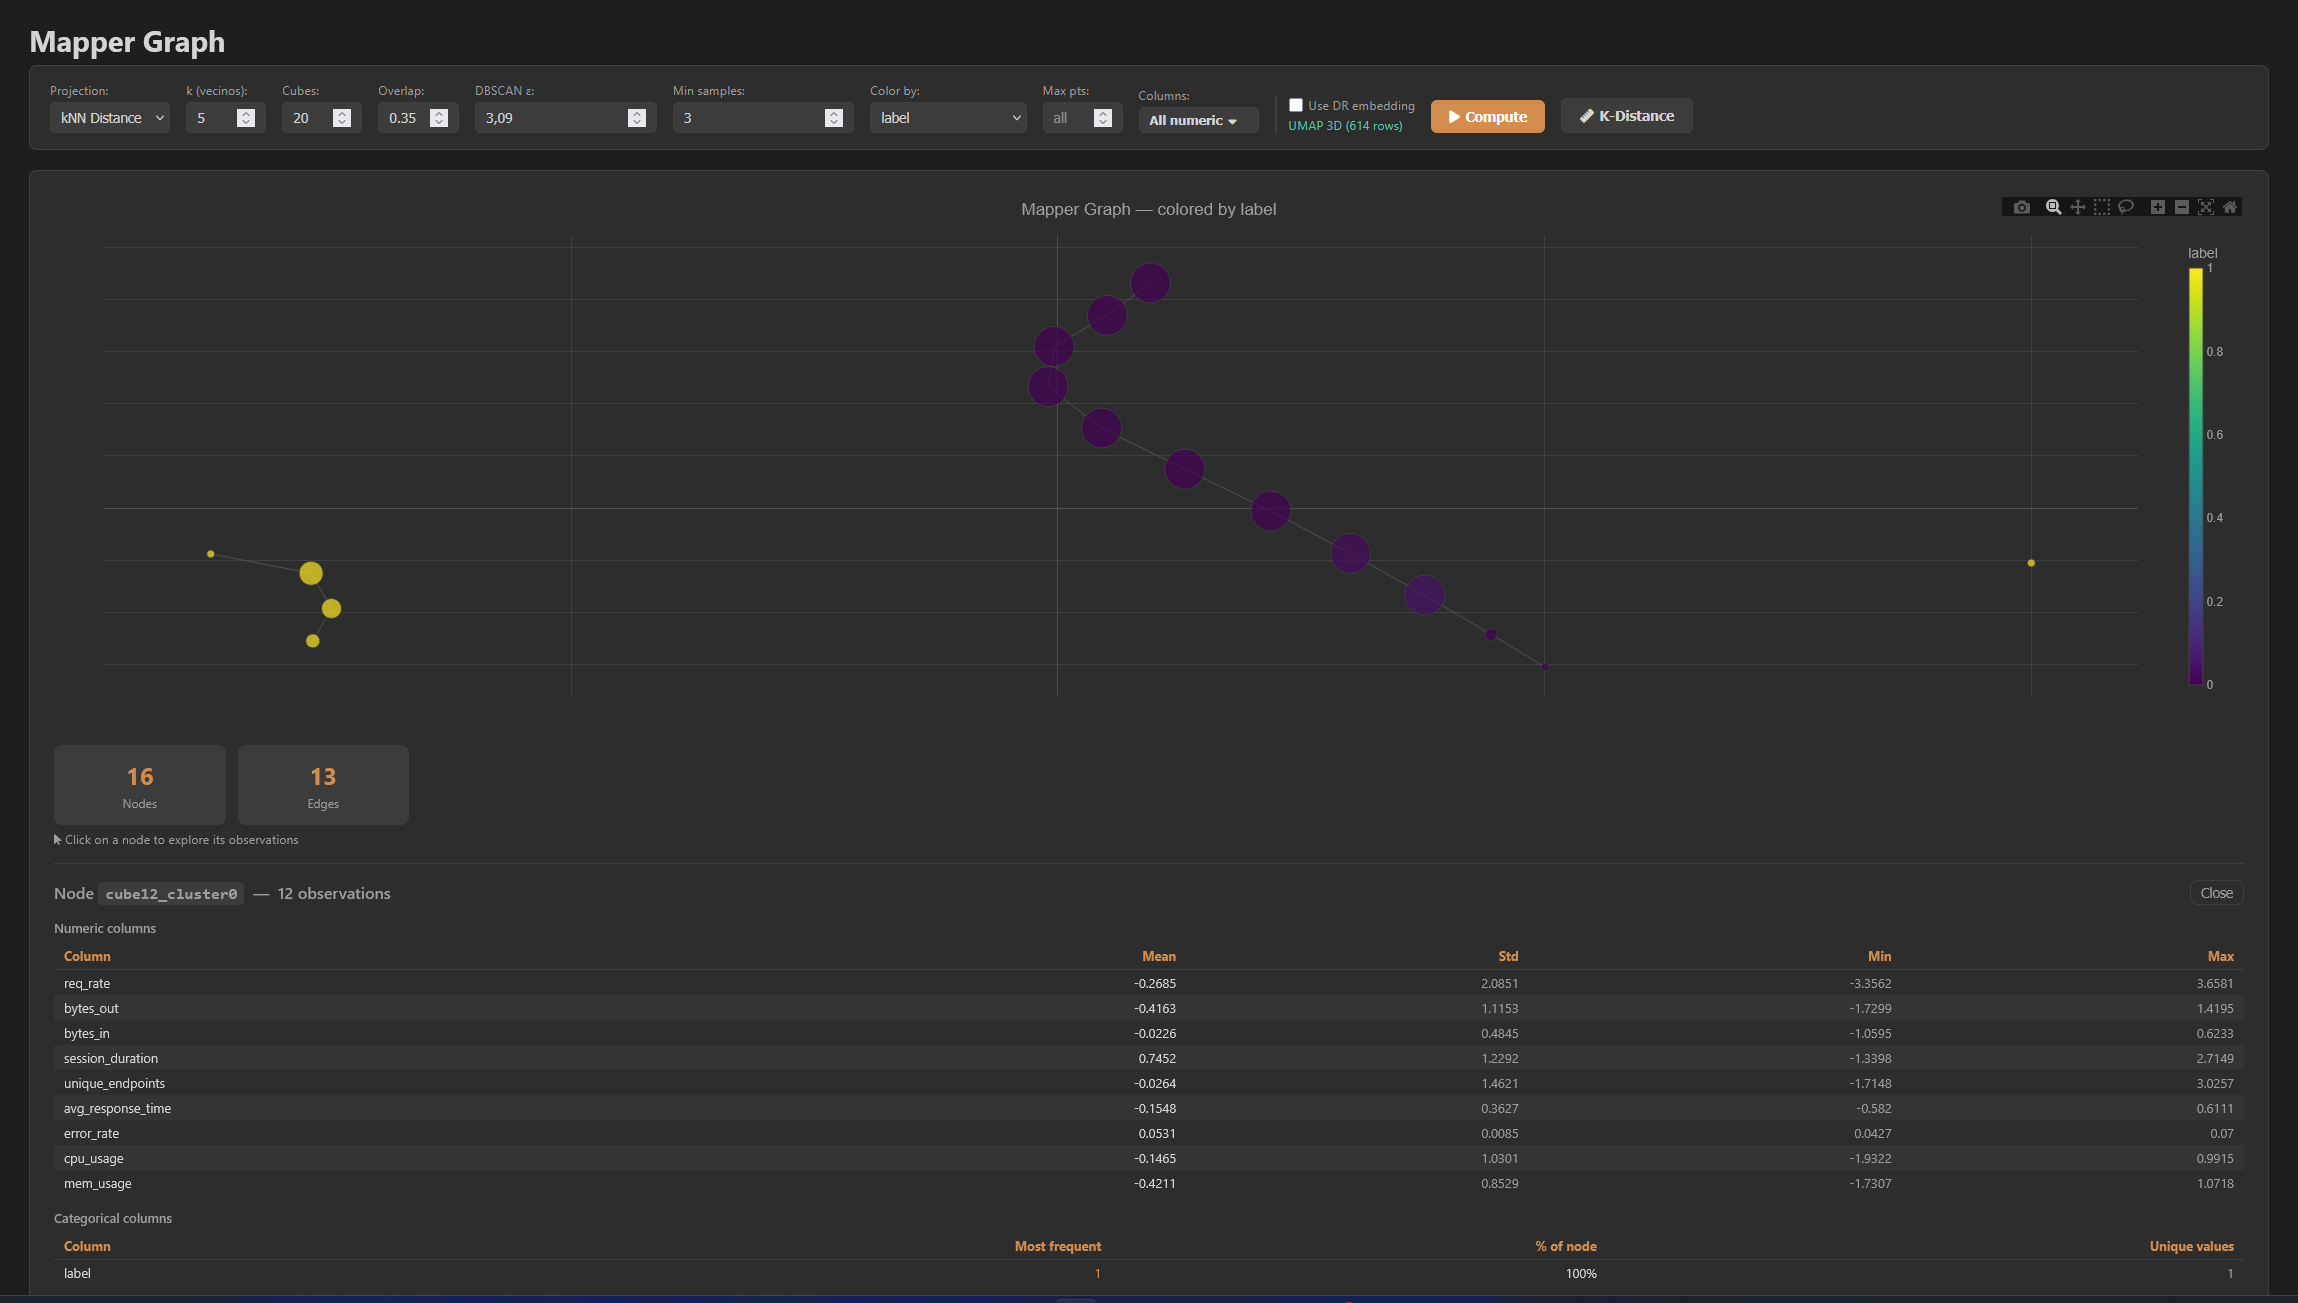
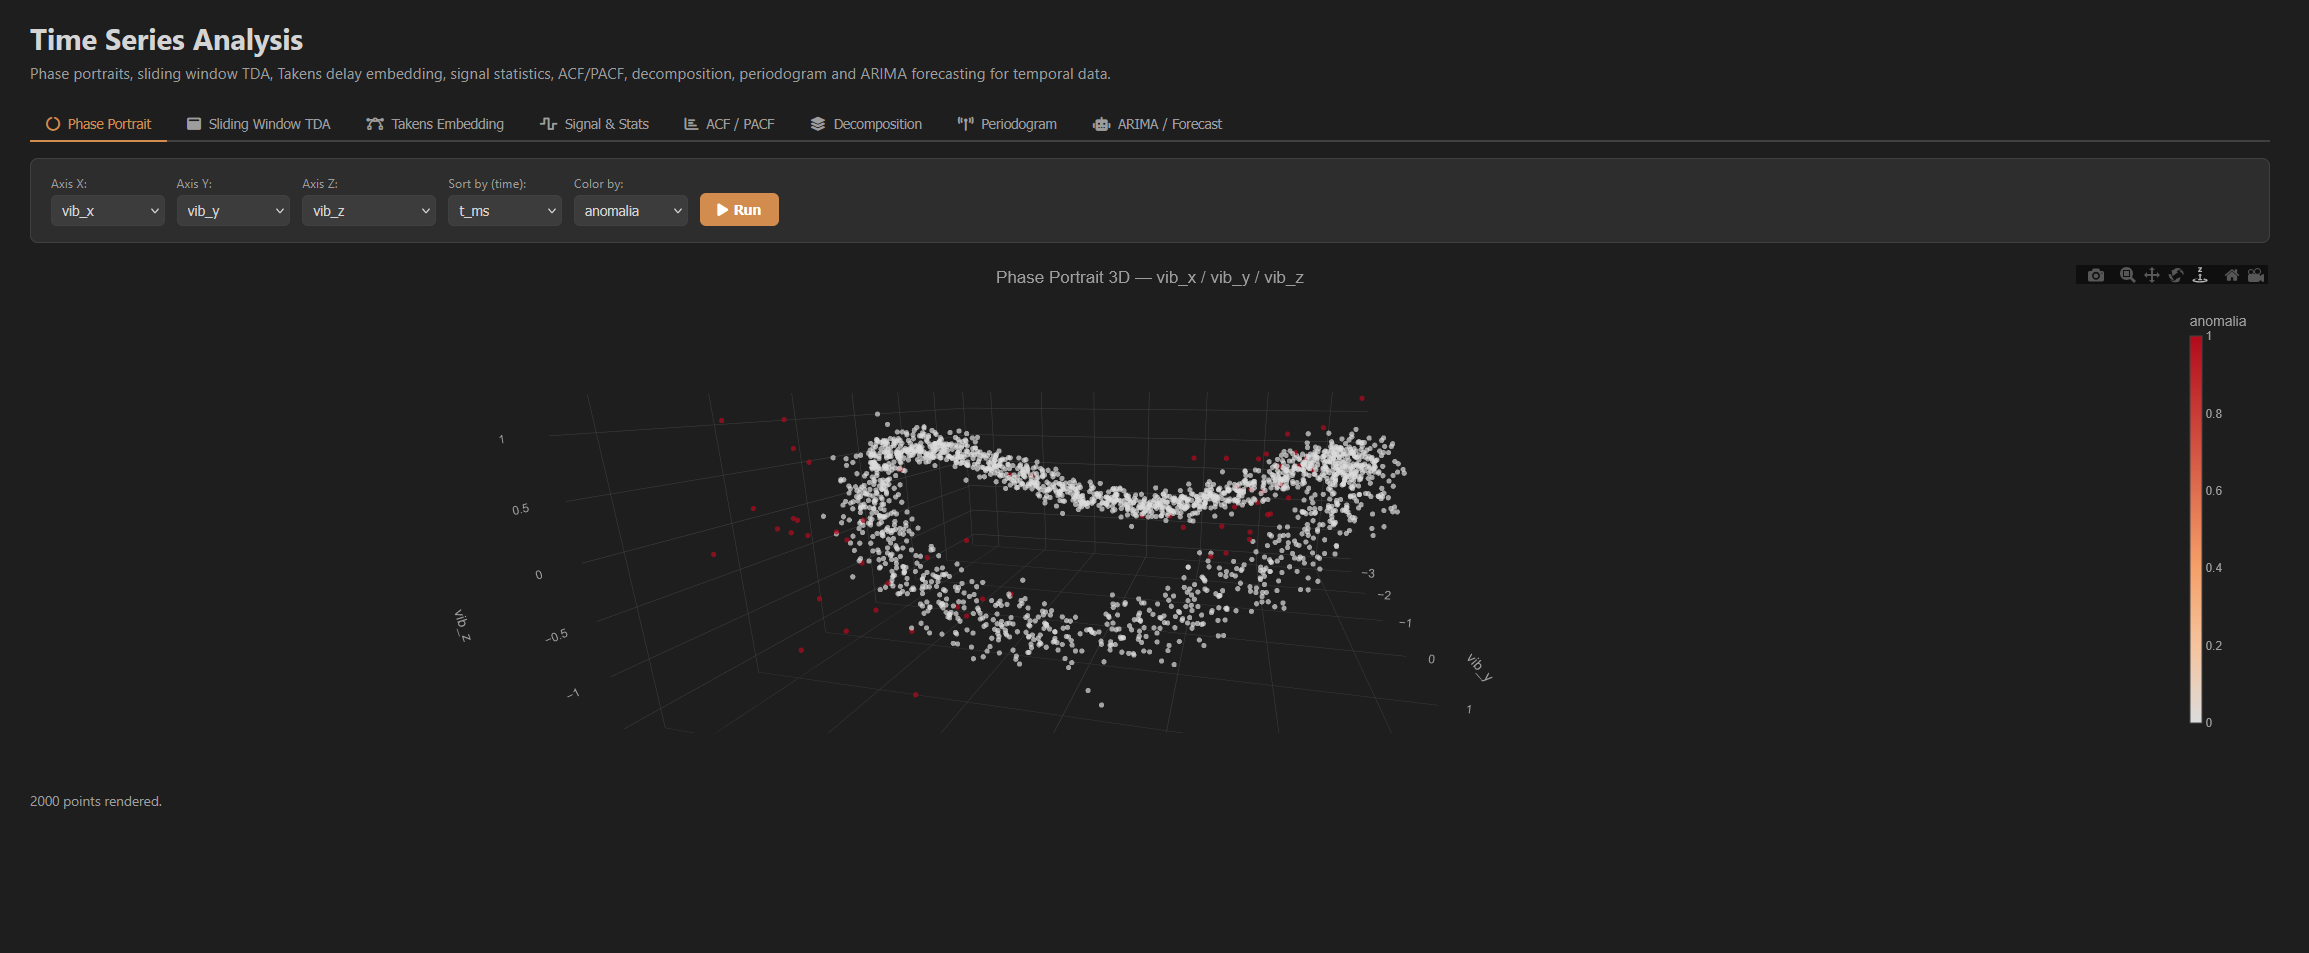
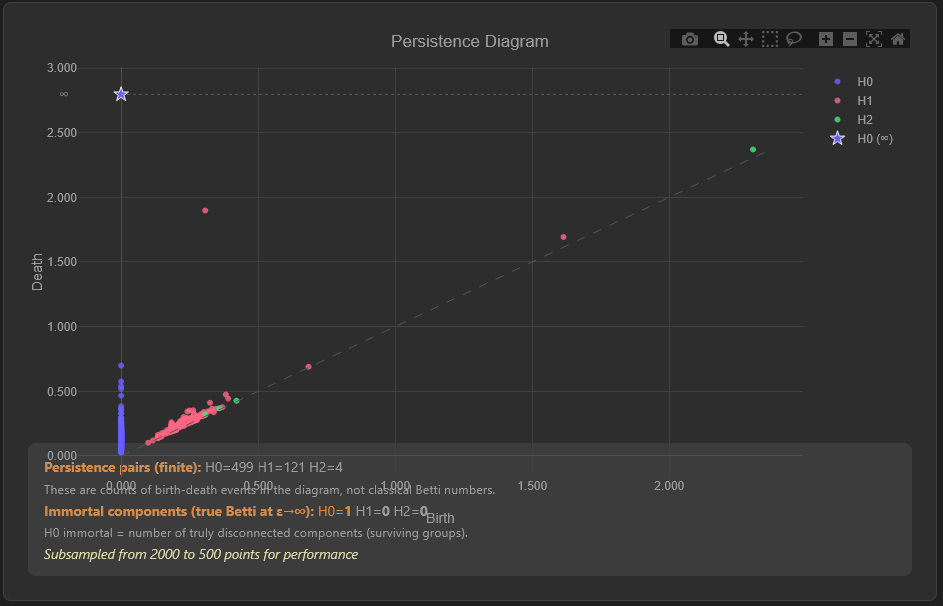
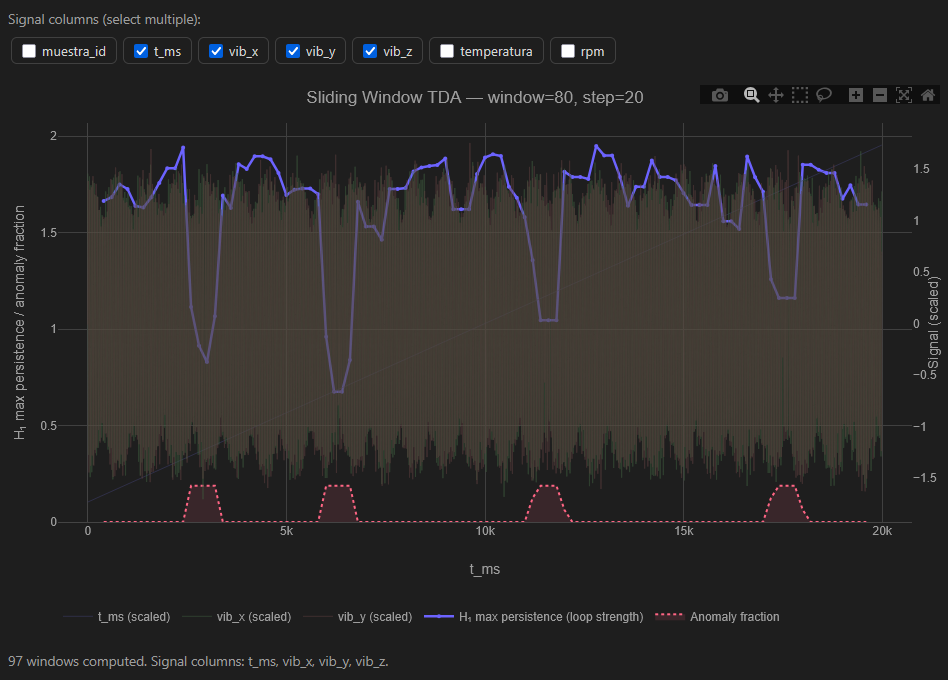
InVariants is a no-code data intelligence platform combining Topological Data Analysis (TDA), machine learning, clustering, anomaly detection, and time-series analytics. The Beta Program provides early access to a pre-release version of the platform for evaluation and feedback purposes. Beta access is granted at our sole discretion, is non-transferable, and may be revoked at any time without prior notice.
3. Grant of Access
Subject to the terms of this Agreement, the Company grants you a limited, non-exclusive, non-transferable, revocable license to access and use the Beta platform solely for internal evaluation purposes during the Beta period. You may not sublicense, sell, or commercially exploit your access; use the platform to provide services to third parties; reverse engineer any part of the platform; or use automated scripts or bots to access the platform.
4. Data You Upload — Your Responsibilities
4.1 Ownership and Rights. You retain full ownership of any data you upload (“Your Data”). You represent and warrant that you own Your Data or have all necessary rights to upload and process it, and that it does not violate any applicable law or third-party rights, including privacy rights under the EU General Data Protection Regulation (GDPR, Regulation 2016/679).
4.2 Sensitive Data. You should not upload special category data under Article 9 GDPR (health, biometric, racial/ethnic origin, etc.) without explicit legal authorization.
4.3 Your Compliance Responsibility. You are solely responsible for ensuring your use of the platform — including data you upload — complies with all applicable laws. The Company is not responsible for any regulatory or legal consequences arising from data you upload.
5. Data Processing and Privacy
5.1 Processing Role. With respect to personal data in Your Data, you act as the data controller and the Company acts as a data processor (GDPR Article 4(8)). Our processing is limited to providing the service you request.
5.2 How We Use Your Data. We process Your Data solely to provide analytical functionality. We do not sell Your Data, use it to train proprietary AI models without your explicit consent, or share it with third parties except as required by law or to provide the service.
5.3 Data Retention. Your Data may be stored for the duration of your active session. We do not guarantee long-term persistence of data. Upon termination of your Beta access, Your Data may be deleted without prior notice.
5.4 Contact for Data Protection matters: [email protected]
6. Beta Software Disclaimer — No Warranties
THE PLATFORM IS PROVIDED “AS IS” AND “AS AVAILABLE” IN BETA FORM. THE COMPANY EXPRESSLY DISCLAIMS ALL WARRANTIES, EXPRESS OR IMPLIED, INCLUDING WARRANTIES OF MERCHANTABILITY, FITNESS FOR A PARTICULAR PURPOSE, ACCURACY, RELIABILITY, UNINTERRUPTED OPERATION, OR DATA INTEGRITY. Beta software is inherently unstable, may contain errors, and features may change or be removed without notice. Any analytical outputs (ML predictions, anomaly scores, cluster assignments, TDA features, etc.) are provided for exploratory purposes only.
7. Limitation of Liability
TO THE MAXIMUM EXTENT PERMITTED BY APPLICABLE LAW, THE COMPANY SHALL NOT BE LIABLE FOR ANY DIRECT, INDIRECT, INCIDENTAL, SPECIAL, OR CONSEQUENTIAL DAMAGES, INCLUDING LOSS OF DATA, PROFITS, OR BUSINESS DECISIONS MADE BASED ON PLATFORM OUTPUTS. YOU ARE SOLELY RESPONSIBLE FOR ANY DECISIONS TAKEN IN RELIANCE ON RESULTS PRODUCED BY THE PLATFORM. The Company’s total aggregate liability shall not exceed €0, given that Beta access is provided free of charge. Nothing in this clause limits liability for death or personal injury caused by our negligence, or any liability that cannot be excluded under applicable law.
8. Feedback and Intellectual Property
8.1 Your Feedback. Any feedback, bug reports, or feature suggestions you provide grant the Company a perpetual, irrevocable, royalty-free license to use and incorporate them without compensation or attribution.
8.2 Platform IP. The Company retains all intellectual property rights in the platform. Nothing in this Agreement transfers any such rights to you.
9. Confidentiality
The platform is pre-release software. You agree not to publicly disclose, benchmark, or publish results about the platform’s performance without our prior written consent, and not to share your access credentials with any third party.
10. Term and Termination
We may terminate your Beta access at any time for any reason. You may terminate by ceasing to use the platform and requesting account deletion at [email protected]. Sections 4, 5, 6, 7, 8, 9, and 11 survive termination.
11. General Provisions
11.1 Governing Law. This Agreement is governed by the laws of Spain. The EU General Data Protection Regulation applies to the processing of personal data.
11.2 Dispute Resolution. Any dispute shall be submitted to the exclusive jurisdiction of the courts of Salamanca, Spain.
11.3 Entire Agreement. This Agreement constitutes the entire agreement regarding the Beta Program and supersedes all prior communications.
11.4 Changes. We may update this Agreement at any time. Continued use of the platform after notification constitutes acceptance of the updated Agreement.
Contact: [email protected] — Atem Nuevas Tecnologías SL, Salamanca, Spain